Facebook and Microsoft: A Financial Statement Analysis Comparison Across Three Categories
Evaluating risks, performance, financial health, and future prospects of Facebook and Microsoft
1. Introduction
In this article I will analysis the financial statements of the social media network Facebook and the software publisher Microsoft in the Internet industry. The project goal is to evaluate risks, performance, financial health, and future prospects of the two firms. I will specifically analyse the complex and ambiguous revenue recognition and the impact of M&A on the companies’ financial statements. In the following I will assess and compare the companies’ strategy, key accounting items, profitability, liquidity, and risk.
2. Company overview and strategy analysis
2.1 Company overview
Facebook’s business model is to provide social networking applications for stories, shops, groups, news feed, marketplace, watch, immersive video, reels, messaging, live, and news. It “enable(s) people to connect and share” and “helps people discover and learn”.¹ The company’s main applications are Facebook platform, WhatsApp, Instagram, Messenger, and Oculus. The firm’s business model relies on selling advertising placements to advertisers. Though personalised ads advertisers can reach people based on behavioural factors. Advertisers buy ads to be advertised across multiple products: Facebook, Instagram, Messenger, third-party apps and websites.
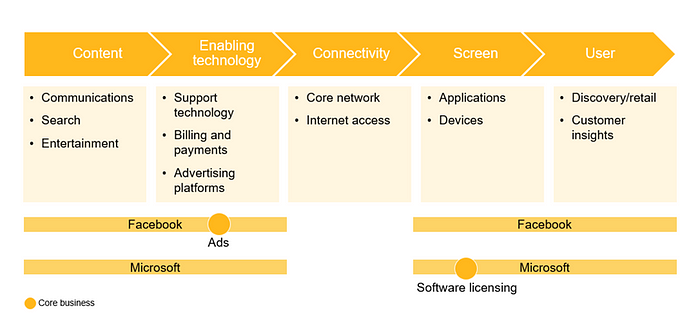
Microsoft’s business model is to develop, license, and support a portfolio of global software products and services.² It also designs, manufactures, and sells devices that integrate with its cloud-based solutions. Furthermore, the firm offers digital advertising globally.
Facebook’s products are Facebook platform, Instagram, Messenger, WhatsApp, and Facebook Reality Labs. The product Facebook platform is an enabler to “connect, share, discover, and communicate” with users on mobile phones or computers. Instagram allows people to share photos, videos, and private messages. The Messenger is a messaging application to connect with people across platforms and devices. WhatsApp is a messaging application to communicate privately. Facebook Reality Labs develops augmented and VR products (Oculus) that help people feel connected.
Microsoft’s products are OS, productivity, server, and business solution applications, desktop and server management and software development tools, and video games. The firm also designs, manufactures, and sells hardware devices such as personal computers, tablets, gaming consoles, and IoT devices. The firm’s products are divided into three segments: Productivity and Business Processes, Intelligent Cloud, and More Personal Computing. The Productivity and Business Processes segment comprises products and services across productivity, communication, and information services such as Office 365 subscriptions. In the Intelligent Cloud segment are the firm’s public, private, and hybrid server products and cloud services: server products and cloud services such as Azure and Enterprise Services such as Premier Support Services. The More Personal Computing segment comprises products and services that put customers at the center of the experience: Windows, Windows Commercial, Windows cloud services, etc.
2.2 Strategy analysis
Regarding its strategy, the social media network Facebook mainly operates in the global digital advertising market.³ Its competitors are search engines, e-commerce websites and other online platforms. The industry’s main buyers are advertising companies, advertising agencies and national governments. Key suppliers are computer manufacturers, information technology and real estate providers.
With regards to Microsoft’s strategy, the main business of the software publisher lies in the software market.⁴ Key buyers in the industry are individual consumers and business end-users. Software developers and makers of hardware are main suppliers.

Facebook’s sources of competitive advantage are its monetizable database, increasing Facebook community, strong liquidity, and revenue growth, despite its business model is threatened by lawsuits for illegal monopolization.⁵ The data that Facebook controls and owns builds its competitive advantage. Its large and monetizable database offers large amounts of highly valuable information about users, their social connections, and their Internet activities to advertisers and developers. The company has a wide and growing global Facebook community across the world: 1.8 billion of daily active users (+11% YoY in 2020) and 2.8 billion monthly active users (+12% YoY) In general, Facebook has strong liquidity and it specifically improved in 2020. The firm’s current ratio was 5.1 in 2020, compared to 4.4 in 2019. Facebook showed a strong revenue growth driven by advertisements in 2020. Its revenue performance was $85,965 million (+21.6% in 2020).
Microsoft’s sources of competitive advantage are its large-scale R&D activities, liquidity position, and increased financial performance, despite the threat of lawsuits.⁶ Microsoft’s competitive advantage stems from a strong focus on research and development. It invests large financial resources in developing technologies, tools, and platforms for digital work and life experiences, cloud services, and devices OS and hardware. Another competitive advantage is Microsoft’s general strong liquidity position. The firm’s current ratio was 2.5 in 2020. Increased revenue performance strengthens the firm’s ability to allocate adequate funds for its growth and expansion plans. In 2020, the company reported revenue of US$143,015 million (+13.6% YoY).
Facebook achieves growth with the help of strategic initiatives, focus on e-commerce business, and positive outlook for global media services market. However, competition pressures, stringent regulatory environment and security breaches may negatively impact reputation and business operations. Facebook achieves growth by strengthening its business through different strategic initiatives. For example, in 2021 Facebook and Shopify formed a strategic partnership to expand its payments tool Shop Pay to merchants on Instagram and Facebook. The company has a strategic focus on e-commerce to grow its business. For instance, in 2020 Facebook completed its launch of a new e-commerce hub, Instagram Shop, in the US. The firm profits from a positive outlook for media services market globally and specifically its largest market North America. The media market in North American is forecasted to reach a market value of $436.7 billion by 2024.
Microsoft achieves growth with the help of the increasing adoption for cloud services, focus on IoT, and strategic acquisitions. Nonetheless, security breaches, foreign currency fluctuations, and high competition threaten its business performance. Microsoft’s growth is built on the foundations of an increasing adoption of cloud services. The cloud computing market is expected to grow largely in the next years. The global cloud services market is forecasted to grow to $719,051 million by 2022 (+25.3% CAGR). The company’s growth is also achieved by its growing presence in the global Internet of Things market combined with the increased adoption for IoT. Its IoT business model allows the firm to generate large revenues and increase its IoT market share in the future. Microsoft’s growth strategy relies on strategic acquisitions to expand its business operations. For example, in 2020 the company acquired the digital video and data management solutions firm Orions Systems to allow retailers to build and train their own AI models.
2.3 Management and ownership analysis
The Facebook board of directors might not seem to have appropriate expertise and experience. In general, in the case of Facebook it is difficult to rate its board of director. There do not seem to be any interdependences between their board sets at other big corporations. But after the Cambridge Analytica Scandal early, long-term board advisors to the CEO turned away from the company. This board shake up might have resulted in taking new members with less expertise and experience on the board.
Microsoft’s board of directors seems to have appropriate expertise — but it might be recommendable to put an employee on the board. Facebook’s board is diverse regarding gender: five out of 12 board members are female. Eleven of these 12 are independent directors. As other technology companies, Microsoft is also facing corporate governance related concerns from their employees. Employees raised issues such as gender discrimination, sexual harassment, and government technology contracts. Therefore, a shareholder resolution asked in 2019 to consider putting a rank-and-file employee on its board.
Facebook’s CEO Mark Zuckerberg does not seem to have the appropriate expertise and experience to successfully run the company in these times. The firm’s CEO is an Engineer by education. During the Cambridge Analytica scandal in 2018, he was criticized for leading the company like an engineer, not as a CEO. His downplay of the scandal and reluctance to transparency caused wide critiques from the media and intensifying scrutiny from the US government. In recent years, the pressure from society and regulators onto the big five technology companies — specifically Facebook — increased due to privacy and competition issues.
The CEO Satya Nadella of Microsoft seems to have appropriate experience. Since his nomination as CEO in 2014, he has transformed the company culture. He fosters an innovative, open, inclusive and diverse company culture.⁷
Facebook has large blockholders as well as a concentration of voting shares. One can say that Facebook is a public company but de facto it is a private because its CEO holds 13% of Total Shares Outstanding. In addition, the company issues dual class shares with no voting right what limits the shareholder power even more.⁸
Microsoft does not have any large blockholders and concentration of voting share. The largest group are traditional investment managers with an equal distribution among themselves.
3. Analysis of accounting
3.1 Unusual accruals
In 2020, Microsoft recorded bad debt expense, an allowance for doubtful accounts receivable. Microsoft’s bad debt as a percentage of accounts receivable decreased from 2018 to 2019 but increased in 2020 exceeding the level in 2018. This means that these increasing bad debts reduces the balance of the company’s gross accounts receivable (contra account). The increase in bad debts in relation to the balance in receivables can be caused by a change in the economy overall or a change in customer base. Normally it should be constant.
3.2 Adoption of new accounting standards
Facebook has recently adopted three new accounting standards in 2020: Fair Value Measurements, Credit Losses, and Income Taxes. The most important here is the changes in fair value measurement. Another significant accounting change happened in 2017, when Facebook changed his accounting standard for stock payments. The accounting change resulted in a reduction of its income-tax provision. Due to the tax benefit, the fourth quarter increased to $214 million, reflecting the tax benefit from a change in the way companies account for stock payments to employees. The new accounting standard aimed at simplifying the companies’ accounting for employee stock payments by the Financial Accounting Standards Board. Companies like Facebook who use stock compensation to employees are expected to have increased earnings. The new accounting standard says that in the event of the execution of an employee’s stock options the tax benefits has to be recognize on the income statement immediately. Consequently, this reduces the companies’ provision for taxes and increases net income.
Microsoft has also recently adopted the new accounting standards. It reported benefits by the accounting change, too. It disclosed that the excess tax benefits decreased its tax provision by $402 million in 2017. Another significant accounting change happened in 2017 when Microsoft as one of the pioneers adopted the new accounting standard for revenue recognition. Due to the new accounting standard, there was an increased quarterly revenue volatility and changes in seasonality. The main effects of the change was on certain license revenues, Windows 10 and commercial subscriptions for several years. No change was on hardware, cloud services, LinkedIn and professional services revenue recognition.
3.3 Cash flows from operations, investing, and financing
Facebook’s Operating Cash flow increased from 2018 to 2020. Its net cash used in investing activities decreased from 2018 to 2020. The firm’s net cash used in financing activities increased in 2019 but decreased in 2020.
Microsoft’s Operating and Free Cash flow as percentage of revenue was fairly stable and slightly growing since 2018. Microsoft continued its cash investments into its property and equipment, primarily to build its cloud services data centers. For three years the firm kept its cash fairly stable with about $13.6bn. Consequently, it opened up the possibility to return cash to its investors. The company paid out $38bn of its $45bn of Free Cash Flow to shareholders as dividends ($15.1bn) or stock repurchases ($23bn). This shows that the firm can self-finance its investments and still return a high amount to its investors. In addition, in 2018 the firm made the acquisition of GitHub for a purchase price of $7.5bn (majority stocks payment). From 2018 to 2020 Microsoft was able to grow its operating cash flow. Despite the fact that the company made investments into its clous infrastructure data centers and offices every year, it was able to increase its free cash flow. In 2017 Microsoft spent $26bn for acquisitions, whereas the main amount was spent on LinkedIn. Microsoft borrow money to finance the LinkedIn acquisition. This had the aim to still be able to pay dividends to shareholders and maintain and increase the current cash pile.
3.4 Revenue recognition policies
Facebook’s financial statements display two situations of ambiguous or complex revenue recognition: Virtually Reality and intangible goods
Facebook bought the Virtual Reality Oculus not only to sell Oculus glasses and the application in games and its software, but also to monetise it beyond these traditional applications.⁹ As an advertising platform, it can deploy different adds formats such as some seconds VR during the loading of the app or full-length video between content breaks. With this kind of VR ads revenue recognition causes questions. Apple’s revenue recognition can act as a blueprint because of similar questions with the iPhone: Is the delivery of the VR glass the end of the transaction and the point of revenue recognition or are maintenance or software so essential to usage so that it requires the revenue to be spread over a period of time? Are modifications or enhancements able to be capitalized or is there a need to expense them immediately?
Besides its advertising revenue, Facebook generates payments from non-advertising revenue such as selling credits for games like FarmVille. Facebook acts as distribution, marketing, promotion and payment platform for popular games creators like Zynga and its game FarmVille.¹⁰ When game players purchase virtual goods, resources like tractors or electricity, with in-game currency during the game Farmville on Facebook, Facebook is the middlemen. That means that it records 30% of these in-app purchases as revenue. 70% go to Zynga but not immediately. Only when Zynga receives the money after some time it can recognize the revenue over time. This follows the rules for revenue recognition for selling virtual goods. Despite the fact that users are not required to use Facebook Credits to purchase virtual goods in Zynga’s games, but Facebook have the control over the payment transaction and the 30% to 70% revenue split. Consequently, Zynga’s net accounts receivable balance increased and most of Zynga’s accounts receivable were owed to it by Facebook.
3.5 Financial impact of M&A activities
Facebook experienced financial impact from its $21.8 billion M&A activity with WhatsApp in 2014.¹¹ Facebook acquire WhatsApp for a large purchase price. From a strategic viewpoint the acquisition made sense for Facebook because WhatsApp is a very popular messaging and communication app. Nonetheless the high purchase price can be criticised because at that time WhatsApp was a start-up with just $22.7 million in 12-month revenue and $312 million 12-month net losses. In consequence, Facebook recorded a high amount of goodwill. The majority of the current $18.7 billion in goodwill can by recorded back to the acquisition. In the last year the pressure for Facebook to start monetizing WhatsApp started increasing.
There have not yet been any goodwill impairments for WhatsApp. But the Financial Accounting Standards Board in the U.S. and the International Accounting Standards Board are currently discussing changes on the treatment of goodwill. Normally, when the acquired company is higher valued than it is worth, this premium is accounted for as an intangible asset, goodwill. If the acquired company is not performing this goodwill has to be impaired. The discussed accounting standard changes would mean that goodwill is instead amortized over time.
I do not think that there will be any goodwill impairments for WhatsApp in the near future because the accounting standard changes would favour Facebook. It could amortize its goodwill instead that is would potentially have to recognise a large impairment. Consequently, it could avoid the negative impact such a large impairment would have caused on the market.
Microsoft experienced financial impact from its $8.5 billion M&A activity with Skype in 2011.¹² Microsoft is used to large acquisitions and large goodwill impairments, but it purchased Skype for a large acquisition price. For this acquisition it recorded a $7.1 billion in goodwill across different segments. This looks like a potential candidate for goodwill impairment. Skype’s previous mother company, eBay, wrote down $1.4 billion of impairments in 2017 related to Skype. This included $900 million in goodwill impairment. Microsoft’s purchasing price was over three times the price eBay paid for it in 2005. Skype is under pressure from competitors such as Zoom and now COVID-19 shows the low performance of Skype under the reign of Microsoft. One can therefore assume that the Skype acquisition was overpaid.
4. Ratio analysis
4.1 Common-size financial statements
Facebook’s common-size Income statement (Exhibit 1) shows that net income as a percentage of revenue decreased from 2018 to 2019 but increased in 2020, not reaching the 2018 level. This decrease in net income is caused by an 51% rise in expenses and slowing growth. In 2019 Facebook struggles to cope with several regulatory issue.
Facebook’s common-size balance sheet item (Exhibit 2) current assets decreased from 2018 to 2019 and again in 2020. In 2019, Facebook exceed financial analysts’ expectations with regards to the top and bottom lines (revenue and profits). Facebook’s net income growth slows (only +6% YOY in 2019 vs. 61% in 2018). The revenue growth continued by 25% year-on-year but was down in comparison to 2018. Ad revenue grew by 25% to $20.7 billion and other revenues increased by 26% to $346 million. Advertising revenue growths was cause by the continued user growth.
On the contrary Facebook’s common-size total liabilities increased in 2019 but slightly decreased in 2020. This is caused by both current liabilities and non-current liabilities which increased in 2019 but slightly decreased in 2020. The total liability increases in 2019 was caused by increasing costs and expenses to at $46.71 billion (+51% YOY) and a decreasing operating margin (from 45% 2018 to 34% 2019). Specifically, capital expenditures (principal payments on finance leases) were $4.24 billion. This growth in expenses outpaced revenue growth for several years but not at this huge extend. In 2019, the company struggles with several regulatory issues related to data misuse and anti-competitive practices. For example, its diversification into the Libra digital currency, which was pushed back by regulators worldwide.
In contrast to Facebook, Microsoft’s common size income statement (Exhibit 3) show an increase in common-size net income in 2019 and slightly decreased in 2020. For three years Microsoft earnings exceeded analysts’ estimates on the top and bottom lines. In 2020 specifically the COVID-19 accelerate the growth of cloud services, Windows, and Xbox ($143bn, 14% annual growth). Microsoft has $60bn of long-term debt (excluding leasing), and a major part of it was secured in 2017 (fiscal year) when it acquired LinkedIn. Debt is being slowly repaid, and its share decreases. This trend is slightly offset by increase in lease liabilities from finance and operating leases. Total Microsoft’s lease liabilities were $17bn in 2020.
Microsoft’s common-size balance sheet item (Exhibit 4) current assets decreased from 2018 to 2020. But property and equipment as a percentage of total assets increased from 2018 to 2020. Total assets increase of $301bn (+$15bn) in 2020 was mainly caused by the increase in investments into property and equipment (+$7.7bn YOY). The other part was mainly caused by an increase in Account receivables and Cash. In 2020, the company saw strong continued growth in Office 365, Microsoft Azure, Windows, and Xbox, because of the pandemic. The requirement to work from home caused an increasing demand of remote work tools and video games. 40% of Microsoft’s revenue was generated by Azure and 20% from Office. With its good performance since three years, Microsoft’s commercial cloud business in 2020 recorded a record in $50 billion annual revenue for the first time (+56%, Microsoft Office and Azure)
Microsoft’s common-size total liabilities decreased from 2018 to 2020. This is mainly caused by long-term liabilities as percentage of stockholders’ equity decreased from 2018 to 2020. It is also caused by common-size current liabilities’ increase in 2019 and its slight decrease in 2020. Liabilities and Equity increased by $15bn and mainly caused by the $16bn increase in Equity. Lower performance showed Microsoft’s Office and Windows businesses in 2019 (34 percent decline in revenue) because of the decrease in transactional licensing to SMEs. This is caused by an ongoing transition of business customer to cloud services from on-premises agreements such as transactional licensing.
4.2 Return on Equity
Facebook’s dip in financial statements in 2019 is reflected in its Return on Equity (Exhibit 5). In 2019 the amount of how much profit Facebook generates for of each dollar of equity (ROCE) decreased to a three years’ low of 23%. The main reason for the decrease in ROCE in 2019 is the decrease in profitability measured by the profit margin ratio. The decrease in the net profit margin in 2019 (26%) shows that Facebook generates less profit for each dollar of revenue than in 2018 and 2020. Only the asset turnover from 2018 to 2020 shows that Facebook generates a fairly stable revenue ratio for each dollar in assets from 2018 to 2020. Capital structure leverage increased to a three years’ peak in 2019. The leverage in 2019 shows that has 1.32 times more in assets for each dollar of equity than in 2018 and 2020.
In contrast to Facebook, Microsoft’s Return on Equity (Exhibit 6) increased from 20% in 2018 to 38% in 2019 and went nearly stable with 37% 2020. Within the three years, Microsoft’s ROCE ratio is significantly higher than Facebook’s. In 2019 the amount of how much profit Facebook generates for each dollar of equity decreased to a three years’ low of 23%. The main reason for the increase in the return on equity ratio is the increase in the profit margin ratio (+16pp). A sharp increase in the profit margin ratio from 15% in 2018 to 31% in 2019 and a stabilisation at 31% in 2020 show that Microsoft generates more profit for each dollar of revenue from 2018 to 2020. The asset turnover ratio increases from 2018 to 2020 and shows that Microsoft generates a 47% revenue ratio for each dollar in assets in 2020. In contrast, the capital structure leverage decrease from 2018 to 2020. The leverage in 2020 shows that it has 2.55 times more in assets for each dollar of equity.
4.3 Cash cycle and operating cycle
Facebook’s cash operating cycle (Exhibit 7) reflects its three years’ low in financial statements in 2019.
The turnover ratios measure how efficiently Facebook performs on daily basis to give an understanding how the firm is managing working capital. As Facebook does not disclose its inventory, main turnover ratios are the collection of receivables and making a payment on accounts payable. The low in financial statements in 2019 is mainly affected by the decrease in Facebook’s payables turnover ratio from 2018 to 2019 and its increase in 2020 above the 2018 level. This means that it takes Facebook longer to pay off its suppliers than in 2019. The receivables turnover ratio slightly improves over the three-year time period. The trend is reflected in the average payables’ payment period. The number of days of payables outstanding peaked in 2019.
In contrast to Facebook, Microsoft financial statements items allow to calculate the cash cycle and operating cycle (Exhibit 8). Overall Microsoft against Facebook showed off its highly efficient working capital management through improved inventory management and cash management. Microsoft’s cash and operating cycle reflect the steady increasing trend in Microsoft’s financial statements over the three years. Both Microsoft’s operating cycle (113 vs. 97) as well as cash conversion cycle (31 vs. -2) improved from in 2018 to in 2020.
This is caused mainly by its three years’ improvement of the inventory turnover ratio (15 in 2018 vs 24 in 2020). The slight improvement in receivables turnover ratio also increased the trend. The payables turnover ratio peaked slightly in 2019.
4.4 Liquidity and leverage ratios
Facebook has a lower Working Capital (Exhibit 9) compared to Microsoft. It indicates that Facebook has slightly less company efficiency and operating liquidity. Therefore, Facebook might have less ability to continue its normal operations without additional debt obligations. Facebook’s working capital is increasing over the three-year period, whereas Microsoft’s slightly dipped in 2019.
Its current ratio and quick ratio question Facebook’s ability to meet its short-term obligations. Over the three years Facebook has a relatively high current ratio compared to Microsoft. It may be a signal that its executive team is not using its assets efficiently. In general Facebook’s liquidity ratios show the three-year trend in its financial statements. The firms current and quick ratio decreased heavily in 2019 (2.5 and 2.4) and slightly improved to a relatively high level in 2020. The sharp decrease of the ratios in 2019 could have been an indicator for the relatively increased risk of distress and default.
In contrast to Facebook, Microsoft’s current and quick ratio (Exhibit 10) are slightly higher than the technology industry average. Since a high in 2018 current and quick ratio were decreasing over the last two years. (2.5 current and 2.3 quick ratio in 2020). The company is improving the efficient use of its assets and therefore even more nearing the industry average.
5. Conclusion
In conclusion, this analysis of Facebook’s and Microsoft’s financial statements in the Internet industry exhibits the differences in overall health, financial performance, and business value of both firms. Both companies operate primarily in high growth markets — Facebook in digital advertising and Microsoft in the software market — but they bear different risks. Facebook’s overall health is mainly threatened by regulatory risk and managerial risk. In contrast, Microsoft bears lower regulatory risk. With regards to performance, both firms hit an all time high in 2020 in revenues. However, Facebook experienced a lower overall performance than Microsoft from 2018 to 2020 and recorded a low profitability, financial ratios, etc. in 2019. Regarding financial health, both companies excelled in liquidity over the last three years — with Microsoft at a higher level. Though, Facebook showed a lower operating efficiency in 2019. In general, the future prospects of the two companies look bright, whereas the financial statements analysis reveals that Facebook is more under pressure. Facebook is now at a growth stage in terms of its size, but its management might not be able to cope with the increasing regulatory scrutiny and its rising expenses.
6. References
[1] Facebook (2020) Annual Report 10-K; Facebook (2021) Investor Relation. Retrieved from https://investor.fb.com/home/default.aspx
[2] Microsoft (2020) Annual Report 10-K; Microsoft (2021) Investor Relation. Retrieved from http://www.microsoft.com/en-us/investor
[3] MarketLine (2021a) Company Facebook Inc. Retrieved from https://advantage-marketline-com.proxy.jbs.cam.ac.uk/Company/Summary/facebook-inc
[4] MarketLine (2021b) Company Microsoft Corp. Retrieved from https://advantage-marketline-com.proxy.jbs.cam.ac.uk/Company/Summary/microsoft_corporation
[5] MarketLine (2021a) Company Facebook Inc. Retrieved from https://advantage-marketline-com.proxy.jbs.cam.ac.uk/Company/Summary/facebook-inc
[6] MarketLine (2021b) Company Microsoft Corp. Retrieved from https://advantage-marketline-com.proxy.jbs.cam.ac.uk/Company/Summary/microsoft_corporation
[7] Roulet, T. (2020) ‘Leadership’, ‘Organisational Behaviour’ Lecture Unit 3
[8] Rau, R. (2020) Seminar Economics, Organisations and Incentives 1–4. Cambridge: University of Cambridge, 1/4
[9] Plaskow, D. (2016) EisnerAmper’s Technology Podcast Series: Virtual Reality. Retrieved from https://www.eisneramper.com/virtual-reality-podcast-1016/
[10] Willis, M. (2021) Seminar Topics in Financial Statement Analysis 1–8. Cambridge: University of Cambridge, 1/8
[11] Facebook (2014) Annual Report 10-K
[12] Microsoft (2011) Annual Report 10-K
7. Appendix
Exhibit 1: Facebook common-size consolidated statements of income
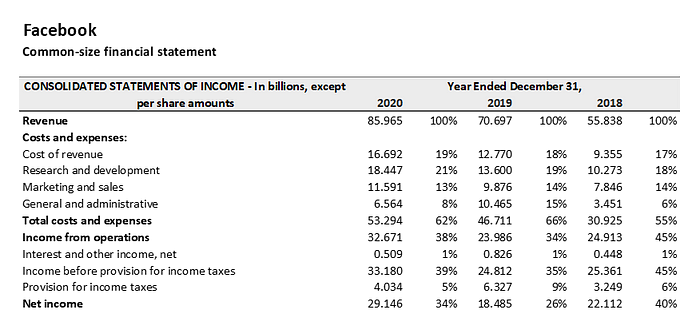
Exhibit 2: Facebook common-size consolidated balance sheets

Exhibit 3: Microsoft common-size income statements
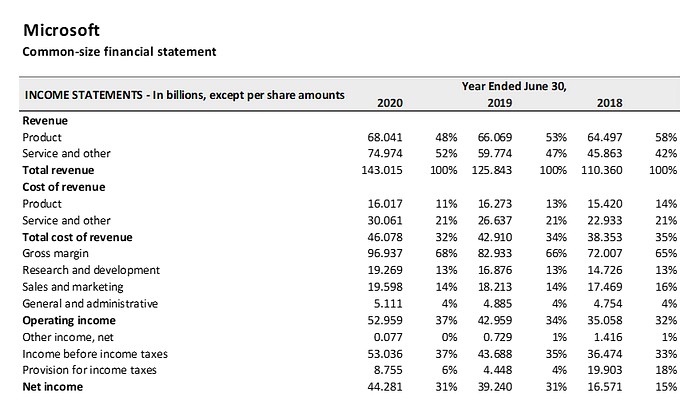
Exhibit 4: Facebook common-size balance sheets

Exhibit 5: Facebook Return on Equity
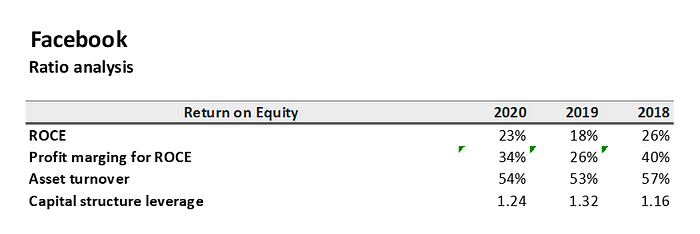
Exhibit 6: Microsoft Return on Equity

Exhibit 7: Facebook cash cycle and operating cycle
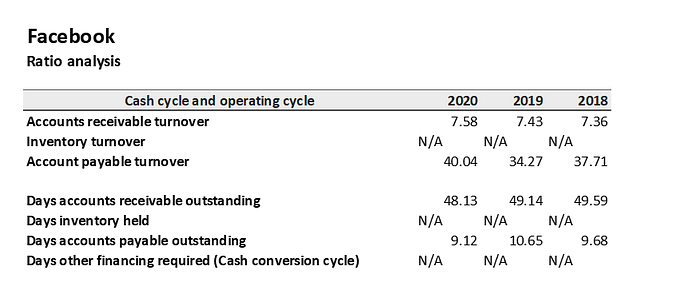
Exhibit 8: Microsoft cash cycle and operating cycle
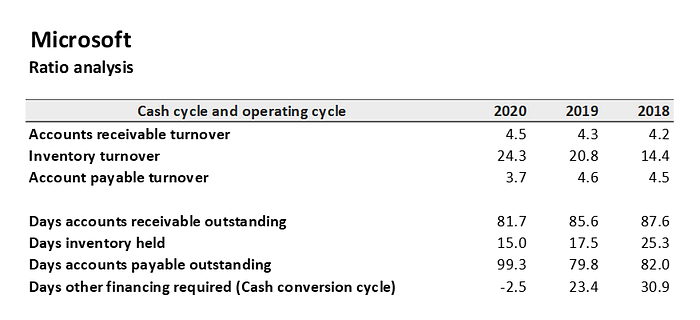
Exhibit 9: Facebook Liquidity ratios
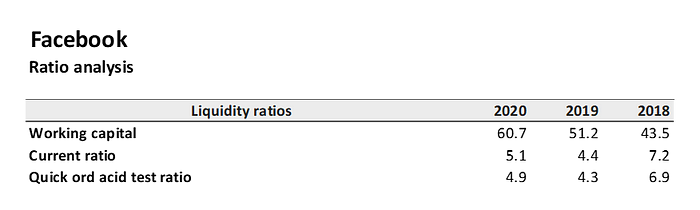
Exhibit 10: Microsoft Liquidity ratios

Thanks for reading! Liked the author?
If you’re keen to read more of my Leadership Series writing, you’ll find all articles of this weekly newsletter here.