Go or no-go decision
How to structure the framework for the investment case Games Workshop
In this article, I will analyse as a buy-side advisor whether Games Workshop would be a good investment, given the massive increase in Games Workshop’s share price today

1. Three arguments that have been made for spending time analysing the annual financial statements to decide whether an investor should invest in a company…
are based on the role of financial reporting in the functioning of capital markets. Capital markets are characterised by (1) information asymmetry, (2) conflicting interests, and (3) expertise asymmetry. (1) Information asymmetry between investors and companies occurs because usually companies have an information advantage over investors regarding the investment opportunity’s value. (2) Both parties can have conflicting interests and credibility problems because the companies’ communication may not be credible due to their incentive to inflate their business ideas’ value. Finally, (3) there is an expertise asymmetry in between the players because in general investors are not sufficiently financial knowledgeable to analyse the value and successfully decide on an investment opportunity.
Institutional forces such as financial and information intermediaries mitigate the above-described issues in capital markets. They provide value to investors by improving their understanding of the companies’ current and future performance. The reason why is because they mitigate the company’s insider knowledge by making it easier for outside players of financial statements to separate reliable information from the company’s distortion and noise. Therefore, the value of financial statement analysis is that it tries to get at the company’s inside information by triangling their good knowledge of the company’s industry and its competitive strategy to interpret the public financial statement data.
Finally, the argument for the financial statement analysis is that when companies have complete information on their strategy and they are not likely to fully disclose this information to investors, it is recommendable to create inside information from analysing financial statements to gain insights about the company’s current and future performance.
Furthermore, research has proven the value of accounting information and accounting analysis. Studies came to the conclusion that the financial and information intermediaries and accounting standards created to mitigate the distortion and noise in financial statements by companies effectively provide assurance to investors. In addition, researchers proved that superior financial statement analysis which can identify the companies with distorted and noisy accounting achieve to create value for investors.
Three arguments that have been made against…
are based on the believe that free market forces will make sure that companies report reliable information.
This believe is based on the point that rational managers will realise that disclosing unreliable information is costly in the long run and consequently will only disclose accurate information. The argument behind is that the long-term costs which occur by the loss of reputation are higher than the short-term gains from disclosing inaccurate information. These long-term costs can be higher capital cost which can incur for visiting a capital market to raise capital over time.
This neglects the diverse factors which influence the quality of accounting-based financial reports. These factors include the superior information which company’s manager has on business activities, the manager’s discretion in accounting choices and his estimation errors, and the incentives for the management of financial reporting items.
Regarding the application of accounting principles which is in the responsibility of the management, the manager’s superior knowledge of a company’s business activities can mislead the investors. This is due to the fact that managers have incentives to distort accounting numbers in their favour. The three main sources of noise and bias in financial statements data are noise from accounting rules, forecast errors, and the manager’s accounting choices.
Regarding the management accounting choices, the following incentives can make managers to choose accounting disclosures that are biased: debt covenants, compensation contracts, contests for corporate control as well as tax, regulatory, capital market and stakeholder, and competitive considerations.
In conclusion, one can say that the free-market forces approach only works for some but not all companies to disclose accurate information.
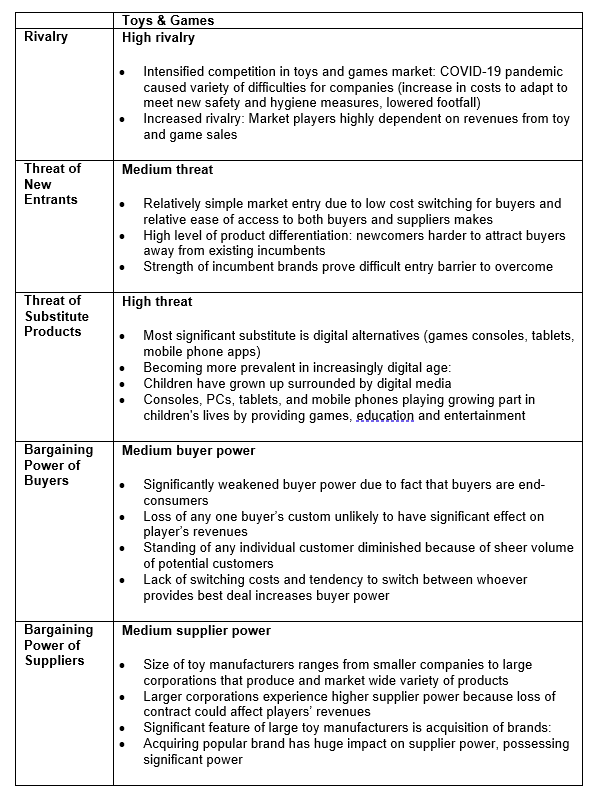
2. The industry in which Games Workshop operates in, the global toys and games manufacturing and retail industry, can be rated…
high in terms of the five competitive forces. Using the industry analysis framework, I have justified my rating in the following.
What does this analysis suggest in terms of industry profitability into the future?
To sum up and to make the point, during the COVID-19 pandemic the competition in the global toys and games industry has intensified due to the challenging operating conditions (strong storage costs).²
Both the high and steady rivalry and the high threat of substitutes caused by technology change account for the high and increasing competition and the decreasing profitability in the games industry.
Most significant substitutes such as digital and video games (medium cheap alternative) gain more and more popularity over traditional toys and games. This is due to the fact that customers are less loyal because of low switching costs (strong low-cost switching). Driven by the global adopting rates of smartphones and the Internet, the games software generated 56% of the size of the traditional market in 2020. In South Korea and Singapore, the games software revenues even surpass the traditional games market’s revenues. The trend into digital alternatives (medium beneficial alternative) will accelerate in the coming years and take customer spend away from traditional games market because the technology change will continue increase.
The fact that the toys and games market is highly fragmented (strong number of players) increases the rivalry in the market. In addition, large incumbents such as Chinese players established a cost leadership (strong low fixed costs) which allows them to compete heavily on price. Moreover, specialised toy and game players are solely dependent on the revenues from their toy and games sales. This causes increased competition because they are required to work profitable in this niche market every time (strong zero-sum game). For the UK, the high rate of price sensitive consumers (strong low-cost switching) causes price to be the main competitive advantage. Recently, discount chains have increased in sales and revenue of toys and games and gained market share. With the aims of opening during COVID-19 lockdown, these players will potentially increase the rivalry in the coming months (strong easy to expand).
In conclusion, the UK toy and games industry maintained moderate growth in recent years, despite the increasing competition from Chinese digital alternatives manufacturers and the difficult operating environment. The toy and games industry is expected to grow moderately over the next five years with a decreased profitability due to the intensified rivalry from Chinese players and digital substitutes.⁴
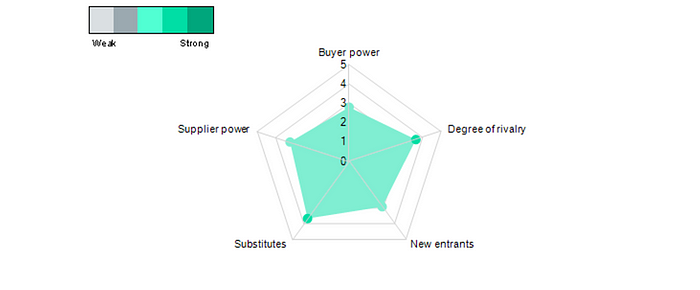
3. The top-two significant accounting policies are…
capitalisation of product development costs and revenue recognition.
Capitalisation of product development costs
The first significant accounting policy is the capitalisation of product development costs, i.e., the timing of the capitalization of product development costs for internally developed games.⁵
This accounts for Games Workshop because they make material investments in non-current intangible assets, such as product development costs.
In 2020, the company incurred £6.0m of capitalised product development costs relating to products they develop to sell through its various channels. The net book value of such capitalised costs was £10.5m.
The accounting flexibility of intangible assets…
is mainly based on two choices: expensing them or capitalizing and amortising them.
First, the expensing of the cost of intangible assets in the period that they arise, would mean to omit them from the balance sheet. This would have two consequences: inflated rates of return on capital and business model assessment. Firstly, omitting intangible assets from balance sheet would inflate rates of return on capital. Consequently, competition would not fully revert back their rates of return to the cost of capital in the long run (inherent biases in long-term forecasts). Secondly, expensing intangible assets, would make the judgement of the company’s business model difficult. The immediate expensing of intangibles undermines the meaningfulness of operating performance as a key success factor for a company’s business model because the expenses required to generate the revenues in this case do not match the revenues (matching concept). Consequently, the immediate expensing of investments in intangible assets would cause non-current assets to be understated.
Second, the capitalisation of intangible assets means to capitalise and amortise them over their expected lives (finite useful life). However, there is an inherent level of accounting flexibility whether the costs capitalised meet the recognition criteria of IAS 38 ‘Intangible assets’ (IAS 38). It is difficult to judge whether internally generated intangible assets qualify for recognition.
Therefore, two issues make it difficult to determine which costs are eligible for capitalisation: determining the cost of the intangible asset and identifying identifiable asset.
First, determination of an identifiable asset specifically involves management judgement as regards to whether these costs are specific to projects which are expected to generate future economic benefits. That means that the costs of the intangible asset are difficult to be determined reliably. In some cases, the cost of the internal generation of the intangible asset are not separable from the cost of the company’s internal generation of its goodwill or its day-to-day business operations.
For these reasons, development costs to capitalize are not material in value and it is difficult to document the basis and thus not many companies capitalize development costs.
Second, a risk exists that capitalised costs will not be supported by the future cash inflows generated from product sales. This means is difficult to identify whether and when there is an identifiable intangible that generates the expected future cash inflows. Consequently, there is a likelihood that developed products will not be commercialised because of infeasible technology or superior competitor products.
The K-IFRS does not provide additional guidance and examples for the toys and games industry in which the product development costs should be capitalised. Therefore, it is difficult to assess whether the product development costs are allocated to the correct project.
How has Games Workshop accounted for these areas…
Instead of omitting the product development costs from the balance sheet, the company capitalised them because they judged the investments to be likely to yield future economic benefits. The decided that the immediate expensing of these investments would lead to artificially permanent abnormal earnings.
Revenue recognition
The second significant accounting policies is revenue recognition, i.e. the timing of revenue and trade receivables recognition.
Due to the information asymmetry, Games Workshop’s managers are the most informed about the company’s revenue recognition uncertainties; this means the extent of the provision of a product to a customer and the likelihood of the cash collection. Caused by some incentives, the managers may accelerate revenue recognition which is characterised by the increase in the current’s periods revenues due to an overstatement of current asset such as trade receivables. An aggressive revenue recognition can be identified by abnormally high receivables in relation to revenues.
In addition, accelerated revenue recognition, can be identified when long-term contracts with customer are involved. Long-term contracts mean the provision of products or services over a longer time period. The IAS on revenue recognition offer the possibility to recognise increments of the product during the contract period, every time when the company fulfils its contractual obligations. The downside is that managers often overstate the percentage of the fulfilled long-term contractual obligations in the current period.
Revenue
In 2020, the company accounted for a revenue of £270 million, increased from £257 million in the previous year. The increase does not seem to be caused by an accelerated revenue recognition by managers; rather the revenues are attributed to the growing income in the company’s core business and in their developing licensing business. In general, revenue is at the beginning of the contract. However, the segment reporting creates uncertainty in the judgment of the company’s accounting choices. The new group structure changed by the replacement of the product and supply segment by the design to manufacture and merchandising and logistics segments. The restatement of the reported segment information for 2019 seems to mitigate the issue because the year 2019 now reflects the structure of the Group.
Royalty income
Games Workshop record a royalty income increase by £5.5 million to £16.8 million in 2020. It does not seem to be attributed to accelerated revenue recognition because the company stated that it was caused by an increase in guarantee income on new contracts signed. The company recognises these revenues fully at the beginning of the contract according to IFRS 15 ‘Revenue from contracts with customers’. Royalty revenues consist of 72% PC and console games, 13% mobile and 15% other.
Trade receivables
In 2020, the company’s trade receivables account for £8 million against £6.7 million in 2019. The increase does not seem to be due to an overstatement of trade receivables in this period. The fair value of trade and other receivables does not differ significantly from the book value. The company initially recognises trade receivables at fair value and carried at amortised cost.
To what extent is there accounting flexibility with regard to these policies?
Regarding Games Workshop’s sales, the accounting flexibility for revenue recognition stems from the different recognition methods based on the type of sales item: permanent, time-based, or usage-based goods. Therefore, the contract specifies when to consider these revenues as realized. Frist, permanent goods are characterised by a permanent usage without limits on time and the usage number. They should be recognised over the average time period of users’ playing the game. Second, time-based items offer the usage for a specific time period. Their revenue should be recognised over the stipulated time. Usage-based goods are eligible to be used certain number of times and consequently should be recognised in proportion to the number of goods used.
With regards to licencing, the accounting flexibility for revenue recognition is caused by the type of transaction. Through licencing, the games manufacturer grants an exclusive right to sell to a licensee to license the developed game. There are two different types of transactions: the initial payment fee and a running royalty. In general, the contract builds the basis for the revenue recognition criteria. However, the timing of the revenue recognition differs according to the type of the license which is constituted by the right to access and use the product.
First, the initial payment fee (minimum royalty guarantees) is characterised by a one-off paid amount for providing an exclusive right to sell during the contract period. Therefore, the initial payment fee is to be recognised over the contract period. Second, the running royalty (additional royalty income) is characterised by a certain percentage of sales which is paid as a royalty. Consequently, their revenue is to be recognised at the time when royalties accrue and on an accrual basis.
Furthermore, accounting flexibility exists to that extend whether revenues should be recognised based on the gross amounts received or net amounts. The question becomes more relevant for Games Workshop when the use of platforms or products developed by third parties becomes more common like it is in the toys and games industry. In general, the accounting choice should be based on the determination whether the company is a principal or an agent for the transaction.
How has Games Workshop accounted for these areas?
Games Workshop accounted for its revenue recognition in line with IFRS standards.
Revenue
For revenues, the company accounts for the revenue at the fulfilment of the performance obligation of the contract with the customer. For sales through their web store and independent retailers, revenue is recognised on the dispatch of goods to the customer. For revenue via their retail stores and digital products, revenue is recognised at the point of sale. For the revenue of magazine subscriptions, revenue is recognised on a straight-line basis over the subscription period. For the goods sold to customers on a sale or return basis, the revenue is recognised after making full provision for the level of expected returns, based on past experience.
Royalty income
For royalty income, the company recognised revenue for the minimum royalty guarantees (initial payment fee) charged on granting use of the intellectual property to licensees and additional royalty income (running royalty) earned as a share of the licensee’s sales of games and products which include use of the company’s intellectual property (IP). First, in accordance with IFRS, the minimum royalty guarantee revenue is recognised in full at beginning of the contract. This is the point in time at which the performance obligation of the contract is met in granting use of the company’s IP. Second, the additional royalty income is recognised in the income statement when it can be reliably measured. The measurement’s point in time of the underlying licensee performance is based on the notification of the company by the licensee and the following validation of the amounts receivable by the company; in short, at the time when royalties accrue on an accrual basis.
Trade receivables
For trade receivables, Games Workshop recognises them in line with IFRS initially at fair value at the original invoice amount and carries them at amortised cost using the effective interest method less loss allowance. In addition, the company uses the IFRS 9 ‘Financial instruments’ simplified approach to measuring expected credit losses, using a lifetime expected loss allowance for trade receivables based on historical credit losses by the Group.
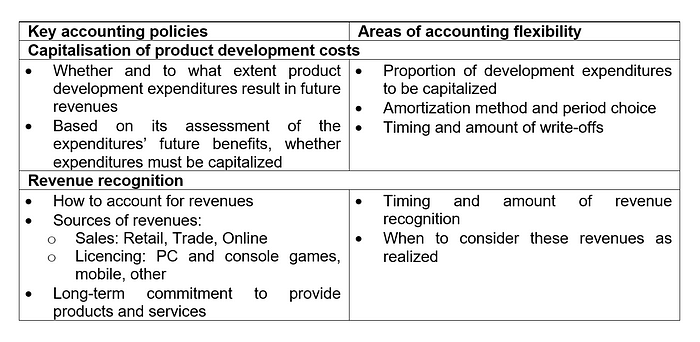
4. Additional accounting policies which I think are relevant to explore in more detail are…
leased assets, impairment of non-current assets, and foreign exchange.
Leased assets
Additional accounting policies which I think are relevant to explore in more detail are…
leased assets.
The first relevant accounting policy, leased assets, is defined by an accounting choice which can lead to the understatement of non-current asset and non-current liability understatement, resulting from off-balance sheet operating leases. This accounting choice was only possible until the adoption of IFRS Standards 16 in 2019.
The accounting choice is characterized by a high amount of off-balance sheet lease commitments before the adoption of IFRS Standards 16 in 2019. The understatement becomes obvious when a huge change in capitalized leases at the time of the standard’s adoption occurred. Consequently, this leads to a distortion of the comparative financial figures.
I choose leased assets…
because the changes in accounting standards to IFRS Standards 16 occurred to Games Workshop in 2020.
My interest in leased assets is grounded on…
The fact that with the adoption of the IFRS Standards 16 in 2019, changes in capitalized leases may have occurred in the toys and games industry and specifically at Games Workshops which leads to a distortion of the financial statements comparability.
The new standard on leases requires a company to recognise a lease as a lease asset as well as a lease liability on the balance sheet. This is to reflect the leases as an asset for which the company receives rewards (right of using asset) and bears risks (obligation for rental payments) on the balance sheet, even though the company does not legally own the asset.
However, before the implementation of the international standard, the companies had two accounting choices to account for leased assets: finance lease method and operating lease method. First, the finance lease method required the company to record the asset and an offsetting lease liability on the balance sheet. The company recognised the asset’s depreciation and interest on the lease liability over the lease period. Second, the operating lease method required the company to recognise the lease as an expense in the period but kept the leased assets off balance sheet.
Accounting flexibility was given in the judgement of whether the lease is defined as finance or operating lease. The previous accounting standards criteria were whether the lessee had accepted most of the risk which bears the ownership (obsolescence, deterioration).
Therefore, the changes in lease accounting standards, make the comparability of the financial statements difficult. To mitigate this significant distortion, the operating leases can be capitalised prior to 2019.
From the financial statements of Games Workshop we understand about leased assets…
that the impact of the adoption of IFRS 16 ‘Leases’ on the financial statements for the financial year 2020 has a significant impact on the carrying value of leases under the new standard.⁶
The company adopted the new international standard from 3 June 2019 on, utilising the modified retrospective approach. This means that the year ended 31 May 2020 is the first financial statement released under the new standard and prior years have not been restated.
This changes in lease accounting standards has a substantial effect of £33.6m on right-of-use assets, £8.8m on current lease liabilities and £24.1m on non-current lease liabilities.
This results in a net book amount of right-of-use assets of £31.9m at the end of the year, a value of the current lease liabilities of £8.3m, and non-current lease liabilities of £23.8m.
The increase in the carrying value of fixed assets and in financial liabilities on the balance sheet on recognition of the new right-of-use assets and their corresponding lease liabilities can be explained by the fact that prior to the new standard financial obligations from operating leases were reported off balance sheet.
Changes in operating expenses and finance charges in the income statement are explained by the depreciation of the right-of-use assets since the date of transition and the interest expense on the lease liability.
Changes in presentation of cash flows in the cash flow statement, are caused by reduced operating cash outflows and their corresponding increase in financing cash outflows. Therefore, total cash flows remain unaffected.
The implied judgements of the management in the adoption of the standard specifically the assessment of the lease term and the discount rate which was applied to the leases seems to be justified. The leases meet the definition of a lease under IFRS 16 ‘Leases’ and lease term is accurate.
Impairment of non-current assets
Additional accounting policies which I think are relevant to explore in more detail are…
the impairment of non-current assets.
Asset impairment occurs if the favourability of the industry environment or the company decrease to an extent at which non-current assets’ fair values would fall below their book values. This is indicated when industry peers recognised asset impairments. Another indication is when the company has a negative track-record in regular write-downs and a trend to delay.
I choose impairment of non-current assets…
because in 2020 the COVID-19 pandemic has had a significant impact on the toys and games industry and Games Workshop specifically. The lockdown and closing of the toys and games retail stores and warehouses have a significant effect on revenue and profits.
The management is required to consider the implications of the COVID-19 pandemic on the company by concern assessment, potential impairment of assets and appropriate disclosure in the financial statements.
The impact of asset impairments may be specifically high in the toys and games industry because of its nature in providing game service to the users. The process requires a publisher to purchase the copyright of a game from a game developer. Despite the fact that the publisher records advance payment and reclassifies it to intangible asset, the company may need to recognise an impairment of the asset if the revenue from the copyright does not reach the expected level.
My interest in impairment of non-current assets is grounded on…
the impact of COVID-19 on the toys and games industry as well as Games Workshop. The decreased industry or company conditions require the company to impair assets at the value of non-current assets at the moment when the impairment arises. Because asset valuation estimates are subjective, manager may be tempted to use their accounting choices to delay write-downs on the balance sheet and hide impairment charges on income statement. Indicators for impairments comprise deteriorating non-current asset turnover, decreases in return on assets, and write-downs of industry peers.
From the financial statements of Games Workshop, we understand about impairment of non-current assets…
that despite the significant uncertainty of the future impact of COVID-19 there are no potential significant impairment indicators at the moment.⁷
Solely, the company recognised an impairment loss of £0.3m for other intangible assets in 2020 in relation to alterations required to previously capitalised elements of the ERP software. This is due to the fact that this has been charged to operating expenses.
Nonetheless, the company should continue to review the risks of non-current asset impairments as the COVID-19 situation unwinds.
Foreign exchange
Additional accounting policies which I think are relevant to explore in more detail are…
foreign exchange.
I choose foreign exchange…
because of the nature of the toys and gaming business and Games Workshop specifically. In general games companies operate across different countries and receive various currencies. This may light to uncertainties in determining the functional currency and possess the challenge of the management in the assessment of the appropriateness of the functional currency.
My interest in foreign exchange is grounded on…
the fact that IAS 21 provides guidance on the determination of the functional currency on an individual company basis but IFRS does not. This means that companies applying IFRS are required to do an assessment of the functional currency. The importance of the functional currency lies in its status as key element specifically when considering changes in the company’s structures which can lead to changes in the company’s autonomy or new strategy implementations.
From the financial statements of Games Workshop we understand about foreign exchange…
that the company has a large currency exposure in Euro and US dollar. Exchange rate fluctuations accounted for a net impact in 2020 on our operating profit was an increase of £0.4 million.
The foreign currency translation seems to be appropriate because items of each of the company’s entities are measured using the currency of the primary economic environment in which the entity operates, the functional currency. Consequently, financial assets and liabilities in other than the functional currency are translated into the functional currency at rates of exchange at the balance sheet date.
5. When analysing and commenting on Games Workshop’s ROE, …
I can say that Games Workshop’s has a superior performance and excellent financial condition, given its strategy and goals.
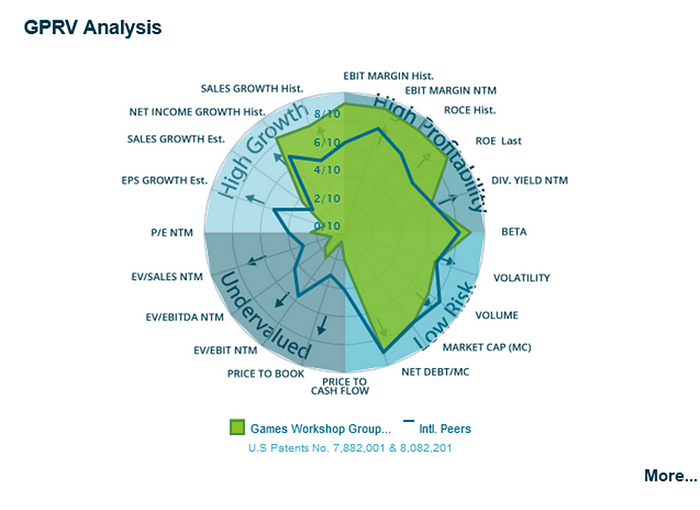
The ratio analysis shows the company’s alternative Return on Equity (ROE) with the three drivers: operating, investment, and financing components.
In 2020, the company shows a high ROE of 59.4% compared to its peers, i.e. the company is making good profits from its assets. Over the 5-years period, Games Workshop has an average ROE of 57.6%. Overall, the high ROE is driven by a high return on net operating assets (RONOA) of 61.7%, a high return on invested capital of 48%, and a high financial leverage gain of 11.3%. First, the high ROE is driven by a high return on net operating assets which itself is caused by a high NOPAT margin of 26.6%. The high NOPAT margin displays the high profitability of the company’s sales from an operating perspective. Second, the high return on invested capital also contributes to the high ROE with its high returns on operating assets of 61.7% and high non-operating investments of 0.22. Third, in addition, the high ROE is driven by the high financial leverage gain which is composed of the high financial spread of 46.1%.
In contrast to 2020, Games Workshop experienced an all-time high of its superior performance and excellent financial condition in 2018 driven by a peak in all three operating, investment, and financing components. The Ratio Analysis sheet presents the alternative decomposition of ROE for Games Workshop. The ratios in this table show that there can be a significant difference between ROA and return on invested capital (ROIC) but nonetheless superior performance in both drivers.
In 2018, for example, its Games Workshop’s superior ROA was 27.4%, while its all-time high ROIC was 62.7%. This difference between the company’s ROIC and ROA can be largely attributed to the company’s current operating liabilities such as trade payables which reduce the amount of net operating assets relative to the amount of total assets. That is, Games Workshop has large current operating liabilities such as trade.
Trade payables help to finance a large proportion of the company’s current operating assets. One of the reasons that Games Workshop’s return on net operating assets is dramatically larger than its ROA is that the company holds a significant amount of excess cash of 17.5% and cash equivalents of 28.5%, possibly to finance its future expansion investments.
The decomposition of returns on invested capital into investment and operating returns shows that the returns on net operating assets of 74.1% were substantially larger than its returns on invested capital of 62.7% in 2018. This is because Games Workshop invested 33 and 26%, respectively, in low-earning non-operating investments. Although these typically liquid and low-risk investments were likely needed to finance the company’s’ growth plans, their immediate effect was to slightly reduce overall business performance.
The appropriate benchmark for evaluating return on invested capital is the WACC. The average return on invested capital for large companies in Europe, over long periods of time, is in the range of 6 to 8%. Games Workshop’s returns on invested capital of 62.7% in 2018 widely exceeds this range, indicating that its operating and investment performance is far above average.
In 2018, Games Workshop saw its NOPAT margin increase and its operating asset turnover grow. Games Workshop’s high margin is consistent with the observation that Games Workshop has a stronger focus on the premium segment of the toys and games industry and on average is asking high premium prices than its peers. Games Workshop’s high operating asset turnover shows that the company is able to utilize its net operating assets very efficiently, which allows them to leverage its high margin and therefore, earn a high return on its net operating assets.
Games Workshop is also able to create shareholder value through their financing strategy. In 2018 the spread between Games Workshop’s return on invested capital and its after-tax interest cost was 60.1%; its debt as a percent of its equity (Financial leverage) was 31%. Both these factors contributed to a net increment (Financial leverage gain) of 18.5% to its ROE.
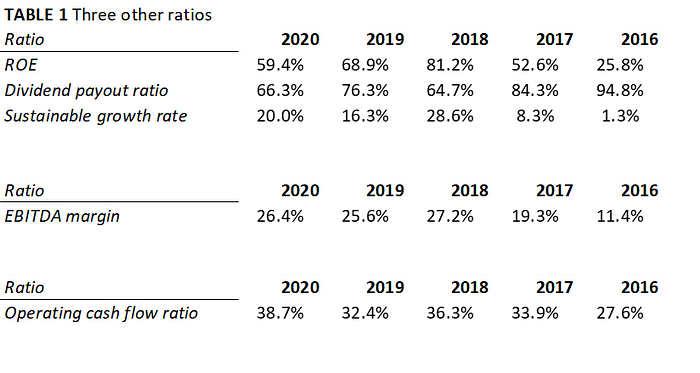
6. The three other ratios that I think are important to understanding Games Workshop’s financial performance are…
sustainable growth rate, EBITDA margin, and operating cash flow ratio.
Sustainable growth rate
First, to understand the Games Workshop’s financial performance, the sustainable growth rate gives a holistic understanding of the ability of Games Workshop to maintain its profitability and financial policies by assessing the company’s ratios in a comprehensive way.
The sustainable growth rate of Games Workshop determines at which rate the company can grow without changing its operating, investment, and financing components. The ratio is defined by the company’s ROE and its dividend policy.
If Games Workshop would call out a rate of above its current sustainable rate, there should be evidence through a change in the financial statement ratios in the future. Therefore, the sustainable growth rate fulfils the role of a benchmark to evaluate company’s growth plans against.
Table 4 shows the sustainable growth rate and its components of Games Workshop. In 2018 Games Workshop had a high ROE but also a high dividend payout ratio, leading to a high sustainable growth rate.
Games Workshop’s sustainable growth rate in 2016 was close to 1% and substantially lower than the company’s average growth rate during the later five years of 14.9%. This observation may raise the question whether the company’s 2016 dividend payout was sustainable. However, Games Workshop’s debt and interest coverage ratios showed that the company’s leverage position was still comfortable and stronger than that of the other industry peers. If Games Workshop anticipated that the decrease in profitability was only temporary, it could have decided to maintain its dividends and finance near-term investments with debt, thereby letting leverage increase a bit further.
Games Workshop’s growth rates of 2020 are close to the company’s long-term average growth rate of around 14.9%. Given Games Workshop’s below-normal leverage of 0.25, this raises the question of whether the company would be better off by increasing its dividend payout ratio of 66.3%, consequently reducing excess cash or making more use of debt to finance its growth than it has done previously. One possible reason for Games Workshop’s managers not to increase dividends, and thus reduce excess cash or take on higher leverage, is that the management expects that the current profitability level under the significant impact caused by COVID-19 will not persist and therefore, wants maintain its cash liquidity and avoid cutting dividends in the future.
EBITDA margin
Second, to understand the Games Workshop’s financial performance, the profit margin is an important key profitability ratio because it helps to identify the drivers of the company’s margins and assess the efficiency of a company’s operating management. Given that Games Workshop and its peers are pursuing different pricing, distribution, marketing, and production strategies, it is not surprising that they have different cost structures. The question is when these costs are netted out, which company is performing better. The EBITDA margin provides useful signals. EBITDA margin provides a comprehensive indication of the operating performance of a company because it reflects all operating policies and eliminates the effects of debt policy, while excluding depreciation and amortization expense. From Table 4 we see that Games Workshop’s EBITDA margin was the worst in 2016 and recovered in the next five years. In 2018 Games Workshop was able to retain a peak close to 27 cents in profit for each euro of revenue, which is more than the 11 and 19 cents the company was able to retain in 2016 and 2017.
Operating cash flow ratio
Third, to understand the Games Workshop’s financial performance, the Operating cash flow ratio is an important ratio. Specifically under the uncertainties caused by COVID-19, the key liquidity ratio assesses the impact of COVID-19 on cash liquidity. The liquidity ratio attempts to measure Games Workshops ability to repay its current liabilities. Especially, the Operating cash flow ratio focuses on the ability of the company’s operations to generate the resources needed to repay its current liabilities. The Operating cash flow ratios for Games Workshop are shown in Table 4 Most of the company’s liquidity situation was comfortable with an average of 33.8%, thanks to its large cash balances and sound operating cash flows. Games Workshop’s Operating cash flow ratio was with 27.6% the worst in 2016 but recovered to acceptable levels in the following five years and reached a peak with 38.7% in 2020. Therefore, the company does not seem to have a material solvency or liquidity risks despite the uncertainties of COVID-19.
7. The key assumptions in the forecast are…
based on the understanding of how different financial statistics tend to behave on average and what may cause Games Workshop to deviate from that average. That means that a portion of the company’s abnormal profits will be competed away and the performance of the firm will revert towards the mean.
My previous industry analysis led to an expectation of significant revenue growth (key driver), because of Games Workshop’s store network expansion in the U.S. and China, an increase in its game store productivity, and an increase in royalty income and online sales.
The projected revenue growth and profit is based on a moderate increased and then declining NOPAT margins. This forecast assumption is based on the assessment of the effects of decreasing inventory markdowns, SG&A cost stickiness reversal, and changes in the Games Workshop’s store portfolio mix.
In general, one would expect revenue and profit numbers to persist at their current levels, adjusted for overall trends of recent years. However, the forecast projects a large increase in revenue and profit numbers over five years.
The forecast resists the general long-term trend that rates of return on investment (ROE) move from abnormal to normal levels, close to the cost of equity capital. The assumption is based on Games Workshop’s sustainable competitive advantage of its superior operating leverage and vast intellectual property which is assumed to mitigate forces of competition from Chinese games manufacturer and digital alternatives.
The forecast does not account for the fact that profit margins (key driver) generally tend to shift to normal levels in the industry. Nonetheless, the forecast’s assumption of a static “normal” is based on the high levels of asset turnover and leverage of the company. The forecast attributed Games Workshop to be capable of creating barriers to entry such as the scale and richness Games Workshop’s intellectual property that may enable them to fight these tendencies towards normal returns.
Nonetheless, given the competition from Chinese manufacturers and digital alternatives the forecast is to be seen critical because it is prudent to assume that given the history of European companies Games Workshop’s competitive advantage will decline over time. Regarding the ratio of working capital to revenue, the forecast assumes that this ratio is to maintain steady at 8.5%, based on the turnover assumption. Based on the assumed shift towards more online sales and royalty income, the ratio of net non-current assets to revenue is expected to remain steady. Under the impact of COVID-19 Games Workshop will likely give priority to maintaining dividends over growing excess cash to finance new stores, the investment assets-to-revenue ratio is held constant at 16%. Games Workshop’s capital structure remains relatively unchanged. As a result, the ratio of debt to book value of capital of 26% is only slightly increased for the duration of the forecast horizon.
8. Share value of Games Workshop using Abnormal Profit Approach

9. Comparing the above valuation against the actual share price, the differences between the valuation and the actual share price can be explained by…
the large number of assumptions by analysts which the valuation but also the market-based share price involves.
At the end of 2020, Games Workshop had 42 million shares outstanding. The above equity value estimate of £1819.9 million on May 31, 2020 thus corresponds with an equity value estimate of £1985.8 million and an estimate of £47.28 per share on April 30, 2021. At that day, the company’s closing share price was £150.00. My estimate of the equity value per share is substantially lower than the actual share price because there were made more conservative assumptions about Games Workshop’s performance after 2020.
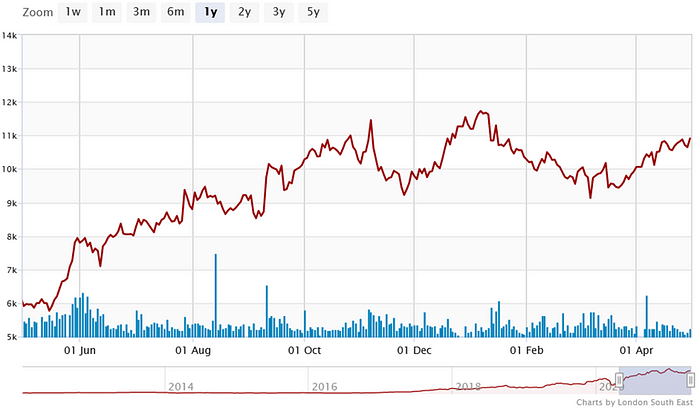
In the last year, Games Workshops share price constantly increased from £96.20 on May 29, 2020 on. Clearly the market is making more optimistic assumptions than original assumption.
One must note that the original forecast assumptions are dated back to December 2020, whereas the share price is based on a current market value in April 2021. Since the annual report 2020 is now dated back one year, the original forecast may have made more bullish assumption in April 2021 for the company’s outlook.
Furthermore, the differences in the two sets of assumptions for the equity valuation and the market value may be related to growth rates, NOPAT margins, or asset turns.
Firstly, the sensitivity analysis of the equity valuation helps to account for the fact that the future of Games Workshop could play out in multiple ways. Therefore, it is recommendable to propose alternative scenarios for the forecast. Frist, if Games Workshop is able to grow its online sales by more than the forecasted percent, increase its royalty income above the expected rate and improve its Warhammer store productivity above the forecast, it will result in higher revenue growth rates in the next five years. Consequently, its value per share would be higher than the current valuation of £47.28 per share. Second, if Games Workshop’s NOPAT margin would gradually increase over the next five years, because of moderate competition, its shares would be worth more than the current estimated £47.28 per share. The resulting changes in the equity value of in these two scenarios are driven primarily by changes in revenue growth and margins, performance measures that are most strongly affected by forces of competition in the toys and games industry.
Secondly, the security analysis helps me to compare the original forecast’s assumptions for the equity valuation with those of the market for the share price. The current share price of £150.00 allows me to infer the market expectations embedded in the share price. The current share price is based on key value drivers and combinations of earnings growth, book value growth, and cost of capital.
Games Workshop currently has an equity beta of 1.07. Given a risk-free rate of 2.25% and a market risk premium between 5.6% and 6.1%, Games Workshop’s cost of equity capital lies between 8.25% and 9.25%.
Two underlying assumptions about the market valuation of Games Workshops are critical: how fast the company’s abnormal profitability will erode and how fast earnings growth will revert to the same level as average companies in the toys and games industry. A full security analysis would derive different scenarios for Games Workshop’s earnings growth which are consistent with the current market share price £150.00. Based on the current share price, these more optimistic scenarios would assume that earnings growth only reverts to the economy average after 2025 and that Games Workshop’s dividend payout ratio between 2021 and 2015 is higher than forecasted.
If growth is higher than forecasted, expected earnings growth remains close to its longer-term historical average during the next five years before approaching the toys and game’s industry’s average after 2025. The market indicates that with an approx. 8.75% cost of equity and an increase of earnings performance, earnings will have to grow significantly per year to justify the £150.00 share price. Given the company’s current share price, it is unlikely that the market anticipates that earnings will be hit by competition before 2025. Instead, the market has good indications to expect that Games Workshop’s abnormal profitability will increase even at a faster rate than forecasted until 2025.
9. References
[1] MarketLine Industry Profile Global Toys & Games Retail February 2021
[2] MarketLine Industry Profile Global Toys & Games Retail February 2021
[3] MarketLine Industry Profile Global Toys & Games Retail February 2021
[4] IBISWorld, Toy, Doll & Game Manufacturing in the US, 2021
[5] Games Workshop Annual Report 2020 page 27 (audit and risk committee report), page 54 (critical accounting estimates and judgements) and note 14 and p. 42
[6] Games Workshop Annual Report 2020 page 27 (audit and risk committee report) and note 3
[7] Games Workshop Annual Report 2020 page 27 (audit and risk committee report)
[8] https://www.infrontanalytics.com/fe-EN/30321EX/Games-Workshop-Group-PLC/financial-ratios
[9] https://www.lse.co.uk/ShareChart.asp?sharechart=GAW&share=Games-Workshop
Thanks for reading! Liked the author?
If you’re keen to read more of my Leadership Series writing, you’ll find all articles of this weekly newsletter here.