Operations Management and Process Analysis
How process analysis contributes to the business success of a leading coffee company
In this consulting project, I introduced operations management, its goals, and its concerns to the CEO of one of the worldwide leading coffee companies. I advised the CEO on the tools and concepts of process analysis. I analysed core topics in process analysis including bottlenecks, cycle time, capacity analysis, and throughput.
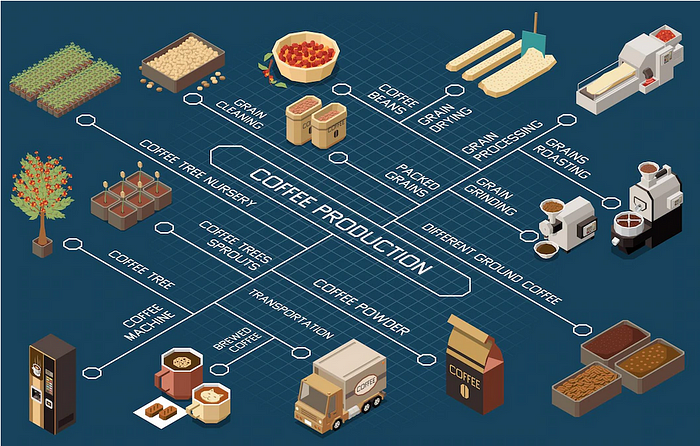
The CEO of one of the worldwide leading coffee companies expanded her business from Singapore to Los Angeles, but with a freshly brewed coffee twist. The business was a huge success and now operates a chain across Los Angeles. But she was aware that the Torrefacto process would soon struggle to keep up with demand.
Torrefacto refers to a process of roasting coffee beans that involves adding sugar during roasting to glaze the beans. The additional sugar increases the effects of the Maillard Reaction, thus giving the beans more of their distinct flavour. Moreover, coffee is one of the commodities whose price has experienced a significant increase along with huge volatility in the world markets. It is therefore crucial for the CEO to improve the performance of Torrefacto process (see below).
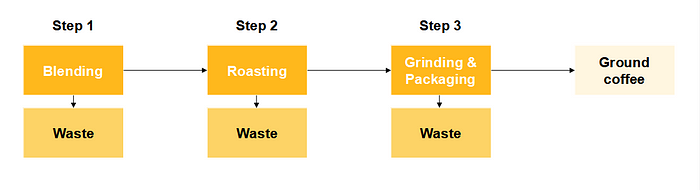
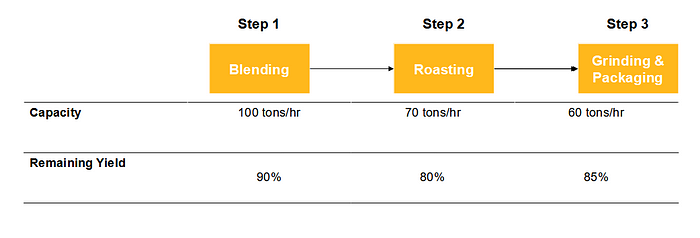
The process consists of three steps: (1) blending of different coffee beans followed by roasting of the blend, and (2) finally grinding and (3) packing. The CEO plans to have three extremely reliable continuous processing machines for the three steps. To ensure the freshness of coffee, at no point in the process can one build work-in-process inventory. The performance of the individual processing machines is described below.
The good news was that the CEO had me available to advise her with the following problems.
1. Utilization per stage
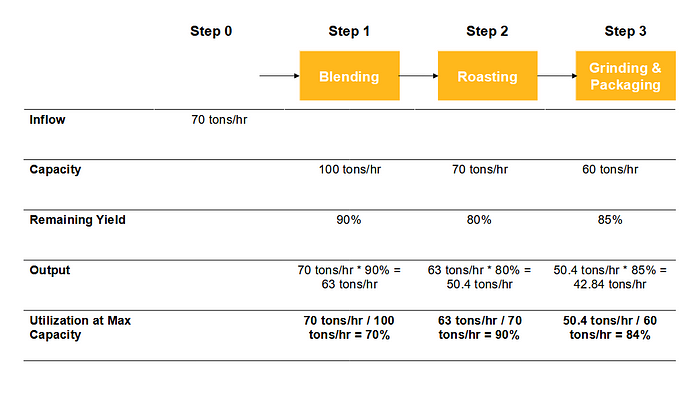
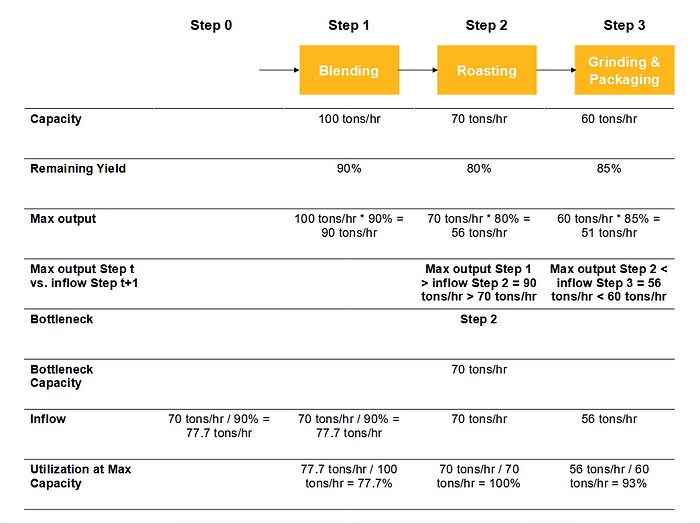
The CEO asked me if 70 tons/hr of coffee beans are introduced to the blending stage, what the utilization of each of the three stages would be. I advised her that if 70 tons/hour of coffee beans are introduced to the blending stage the utilization of Step 1 would be 70%, Step 2 90%, and Step 3 84%.
2. Bottlenecks
The CEO asked me in which step the bottleneck is and why it is the case. I advised her that in the case of an inflow of 70 tons/hour, there is no bottleneck because the maximum capacity in each step is not reached.
In contrary, I advised her that in the case that the inflow of 70 tons/hour of coffee beans is unknown, Step 2 is the bottleneck. Because the maximal output of Step 1 (90 tons/hour) is bigger than the inflow of Step 2 (70 tons/hour). There are no further bottlenecks because the maximal output of Step 2 can be absorbed by Step 3.
3. Capacity analysis
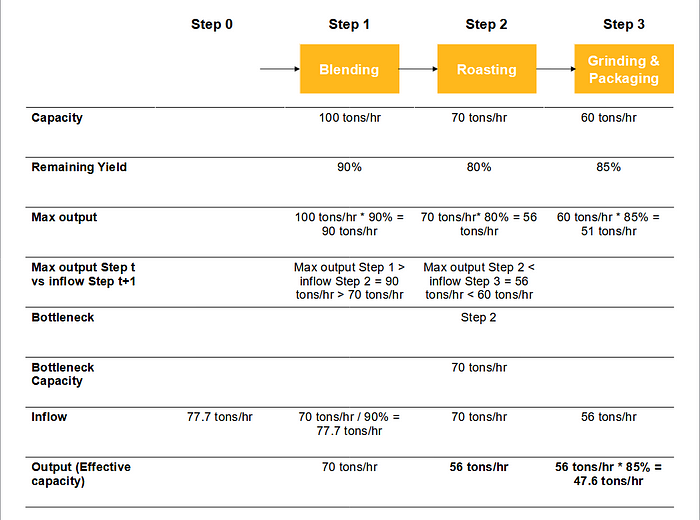
The CEO asked me what the capacity of this plant is (in terms of tons/hour). I advised her that if we assume that the inflow of 70 tons/hour of coffee beans is unknown, the capacity of this plant in the form of output is 47.6 tons/hour. It is determined by the maximal output capacity of Step 2 with 56 tons/hour.
To mitigate the high yield losses, I recommended a number of new technologies that can re-process the losses from the grinding and packing stage. In particular, I considered the following two competing process technologies:
1. Technology A can take all the losses from the grinding and packing stage, and convert all the waste to ground coffee (the final product, see below).
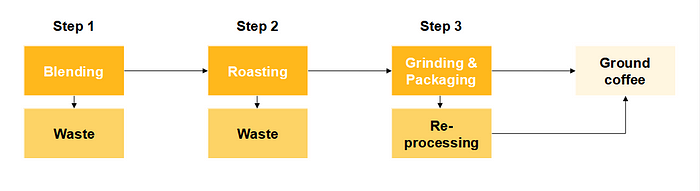
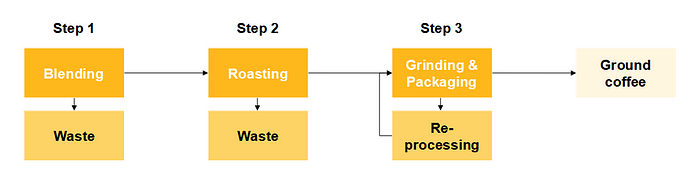
2. Technology B, on the other hand, takes the losses from the grinding and packing stage and re-introduces them back into that stage (see below).
3. Process Technology A
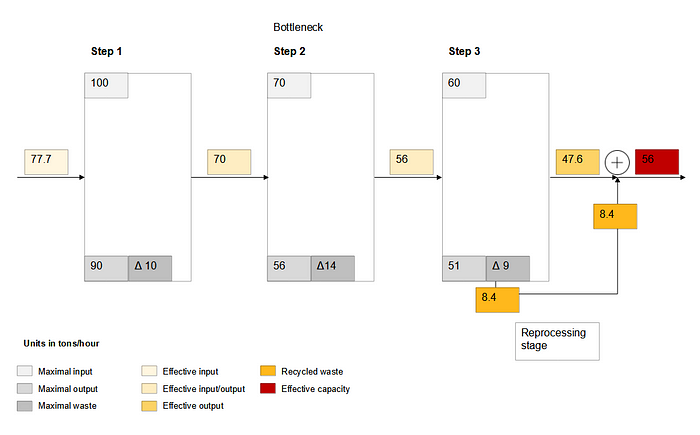
The CEO asked me if Technology A is adopted with a capacity of 10 tons/hour (for the reprocessing stage), what the new capacity of the plant is (in terms of tons/hour). I advised her that the maximal waste of Step 3 with 15% (1- Remaining Yield) of 60 tons/hour max capacity are 9 tons/hour (See graphic Technology A impact). This is less than the capacity of 10 tons/hour for the reprocessing stage. Therefore, all the waste in Step 3 can be converted to ground coffee. The efficiency of the Step 3 incl. the reprocessing stage is 100%. The yield of step 3 is increased from 85% to 100%.
The new capacity of the plant is 56 tons/hour because Step 3 is now working at 100%. The bottleneck of Step 2 (56 tons/hour output) constraints the new capacity of the plant (bottleneck). The 47.6 tons/hour output of Grinding & Packing plus the 8.4 tons/hour output of the reprocessing stage are the new capacity of the plant with 56 tons/hour output.
When the Technology A is adopted, the effective waste is 8.4 tons/hour (56 tons/hour inflow of Step 3 times 15% waste). The effective waste is fully converted by the reprocessing stage and added to the final product.
4. Process Technology B
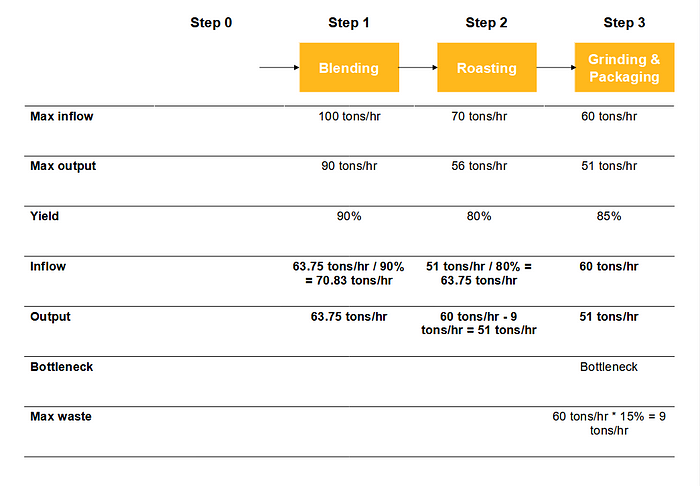
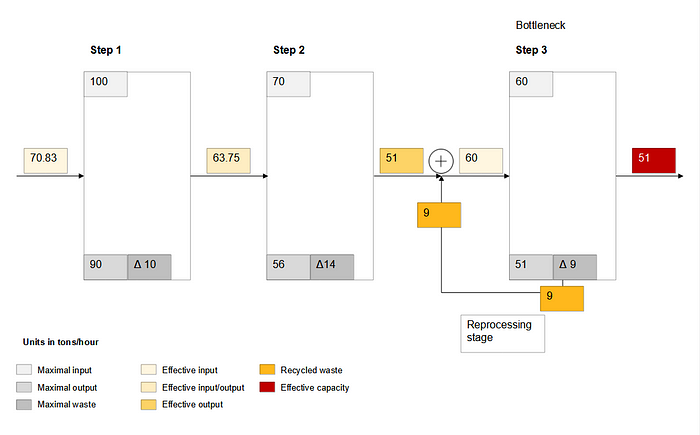
The CEO asked me if Technology B is adopted with a capacity of 20 tons/hour, what the new capacity of the plan is (in terms of tons/hour). I advised her that the new capacity of the plant is 51 tons/hour because now Step 3 is the new bottleneck (see graphic Technology B impact). The capacity of the reprocessing stage of 20 tons/hour is not exceeded by the 9 tons/hour maximal waste from Step 3. Because the maximal inflow of the bottleneck of 60 tons/hour of Step 3 are not allowed to exceed, the output of Step 2 has to be reduced from 56 tons/hour to 51 ton/hr (60 tons/hour max inflow — 9 tons recycled waste). Consequently, Step 2 is not anymore the bottleneck; the output of Step 2 is now below than 56 tons/hour maximal output. The inflow from Step 2 is now 63.75 tons/hour (51 tons/hour output of Step 2 / 80% yield of Step 2). The inflow from Step 1 is now 70.83 tons/hour (63.75 tons/hour output of Step 1 / 90% yield of Step 1).
To sum up, the total yield of Technology A is 72.072% (56 tons/hour total output / 77.7 tons/hour total inflow). The total yield of Technology B is 72.003% (51 tons/hour total output / 70.83 tons/hour total inflow). Both technologies improve the total yield to approx. 72%. But Technology A increases the total capacity to 56 tons/hour versus Technology B to 51 tons/hour. Without technology improvement of reprocessing stage, the total yield would be 61% and total output 47.6 tons/hour.
Thanks for reading! Liked the author?
If you’re keen to read more of my Leadership Series writing, subscribe and get an email whenever I publish an article of this weekly newsletter.